
fanclash
working on India's World's first esports fantasy platform
A/B Testing and Deployment
Usability Test
Quantitative Research
UX Design
their job is to introduce you and other users to the platform

later, you will be able to tell them how you feel — when you use the app
however, not everything was okay when users told FanGuru how they felt
ISSUES
let's take a look at what the users were saying

Simran Gupta
Banker
hobbies: gaming, cooking, hiking
says
It feels great to browse the matches, but I it's too much work to create my own team
Whenever I try to create a team, the rules get me confused and I end up quitting the application

Keshav Singh
YouTuber
hobbies: gaming, cooking, hiking
says
I just use it to learn which gamer scores the most and what matches are popular
I feel that if I understand the team-making more, I would encourage my followers to participate and play with them
to corroborate the findings with user insights, FanGuru asked us to look at conversion data from the app
after looking at the data, specifically for the task where users need to create a team to participate, it turned out that the issues that Simran and Keshav had, were true for a number of users. There were a number for funnels where users were stuck or may have had to face an issue that most of them dropped off the process.
the process where user creates their fantasy team
the number of matches and how to distinguish
the clarity on what the captain does
making a payment to participate in a match
we prioritized the issues that prevented the users from completing the whole process of participation
the process where user creates their fantasy team
how to choose the players
after looking at the data, specifically for the task where users need to create a team to participate, it turned out that the issues that Simran and Keshav had, were true for a number of users. they struggled with choosing the five players for creating a team.
some people like participating, but are not very well versed with players' skills and under confident on who should they choose. it takes them a lot of effort to create a team and they end up closing the app.
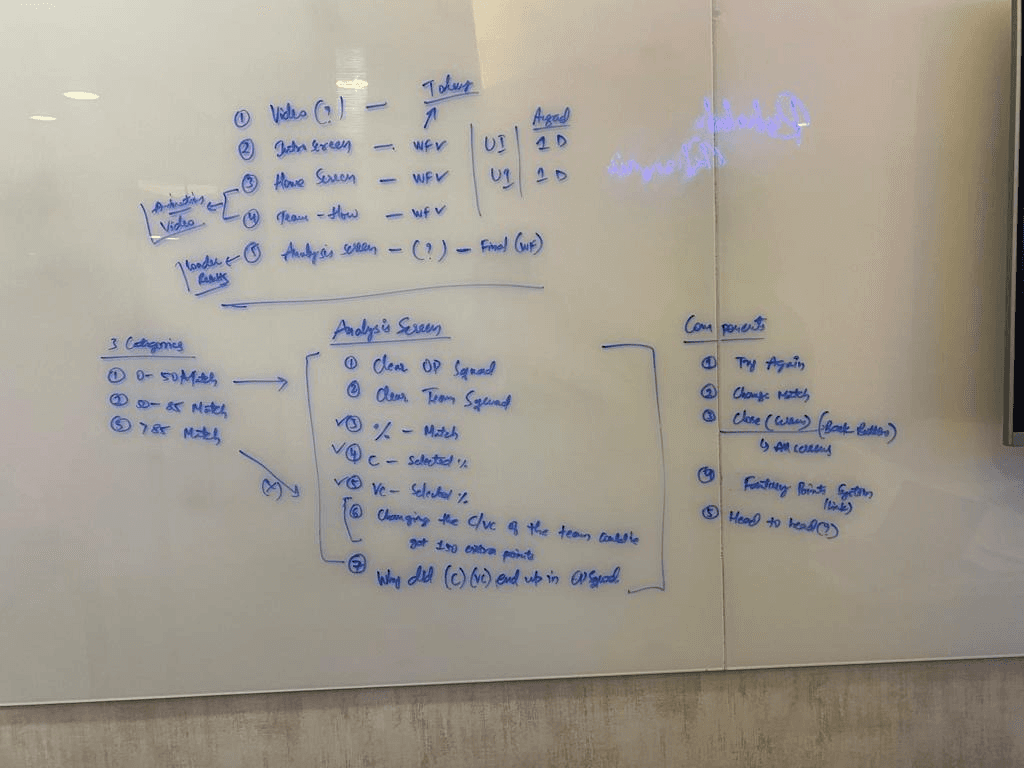
IDEATION
we took an approach to design several solutions by first tracking user behavior on the screens with most drop-offs
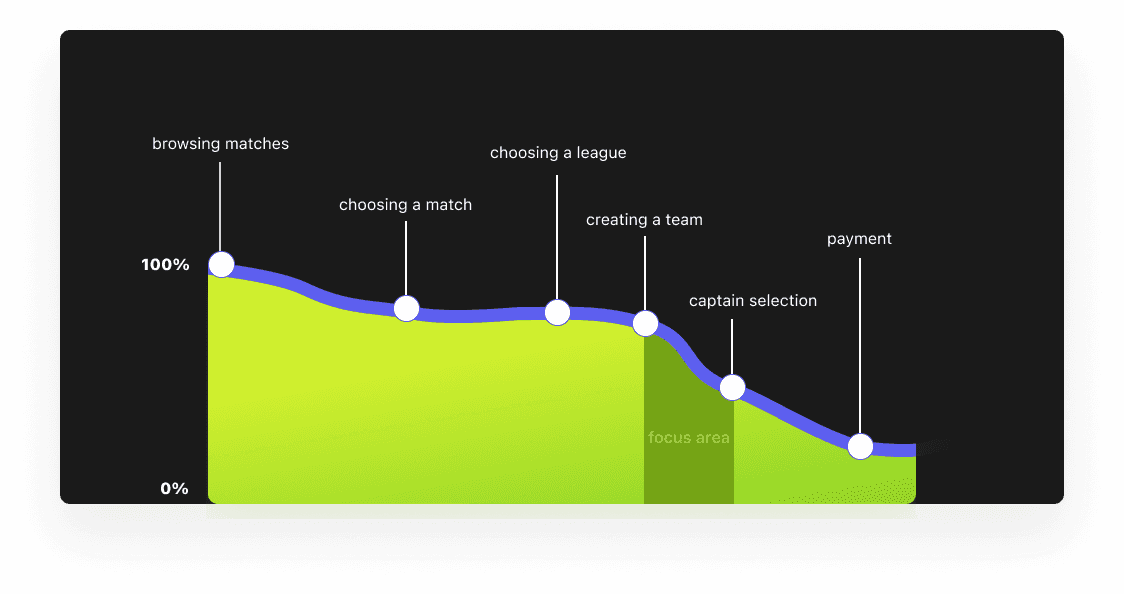
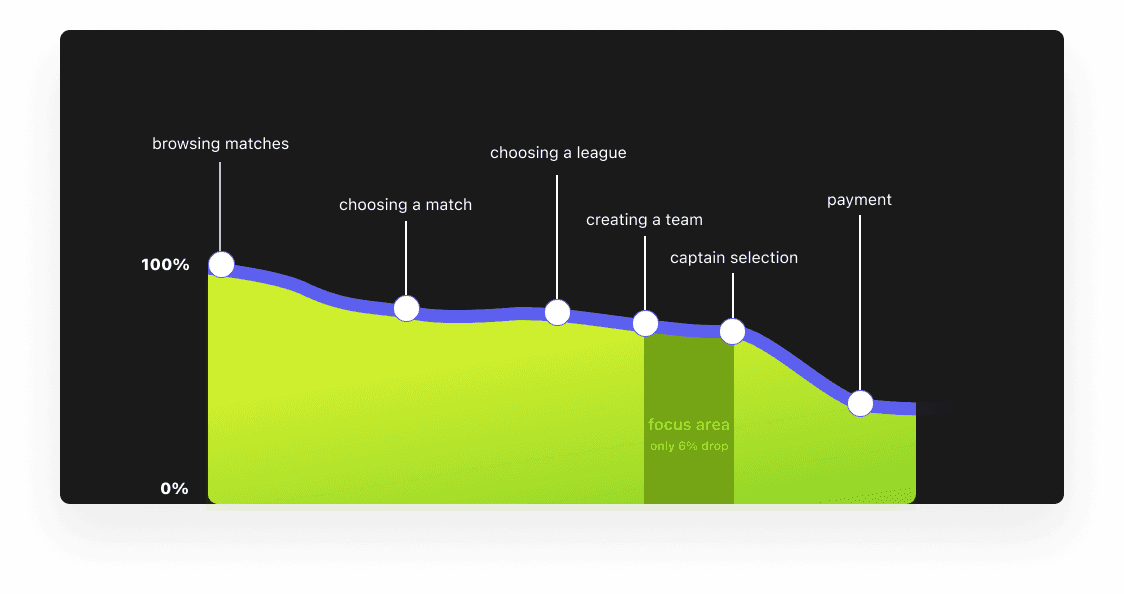
the task completion rate by interaction, illustrated
after looking at the data, specifically for the task where users need to create a team to participate, it turned out that the issues that Simran and Keshav had, were true for a number of users. There were a number of funnels where users were stuck or may have had to face an issue that most of them dropped off the process.
after finding out qualitative data, we also analyzed our system data that indicated a significant drop in the completion rate, highlighted by the focus area in the chart below.
our team brainstorming the user flow to figure out which interactions could be worked upon to improve usability
users, product managers and UX leads working as a team to perform usability tests among our users through google meet.

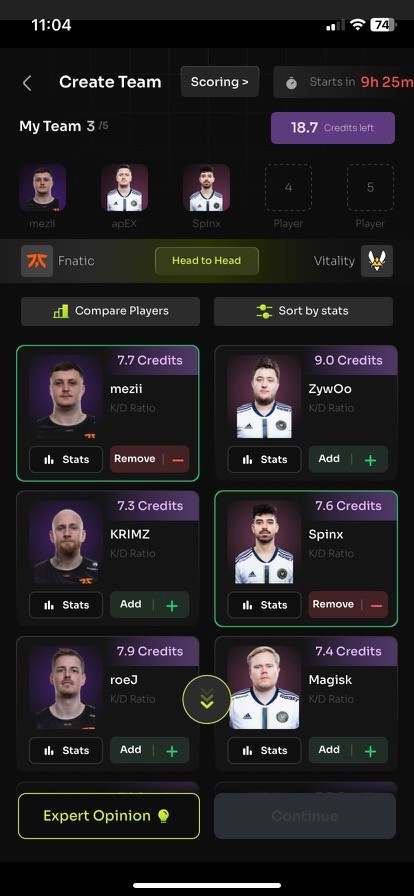
collaborating with the creative lead, I redesigned the screen using re-branded assets
ACTION
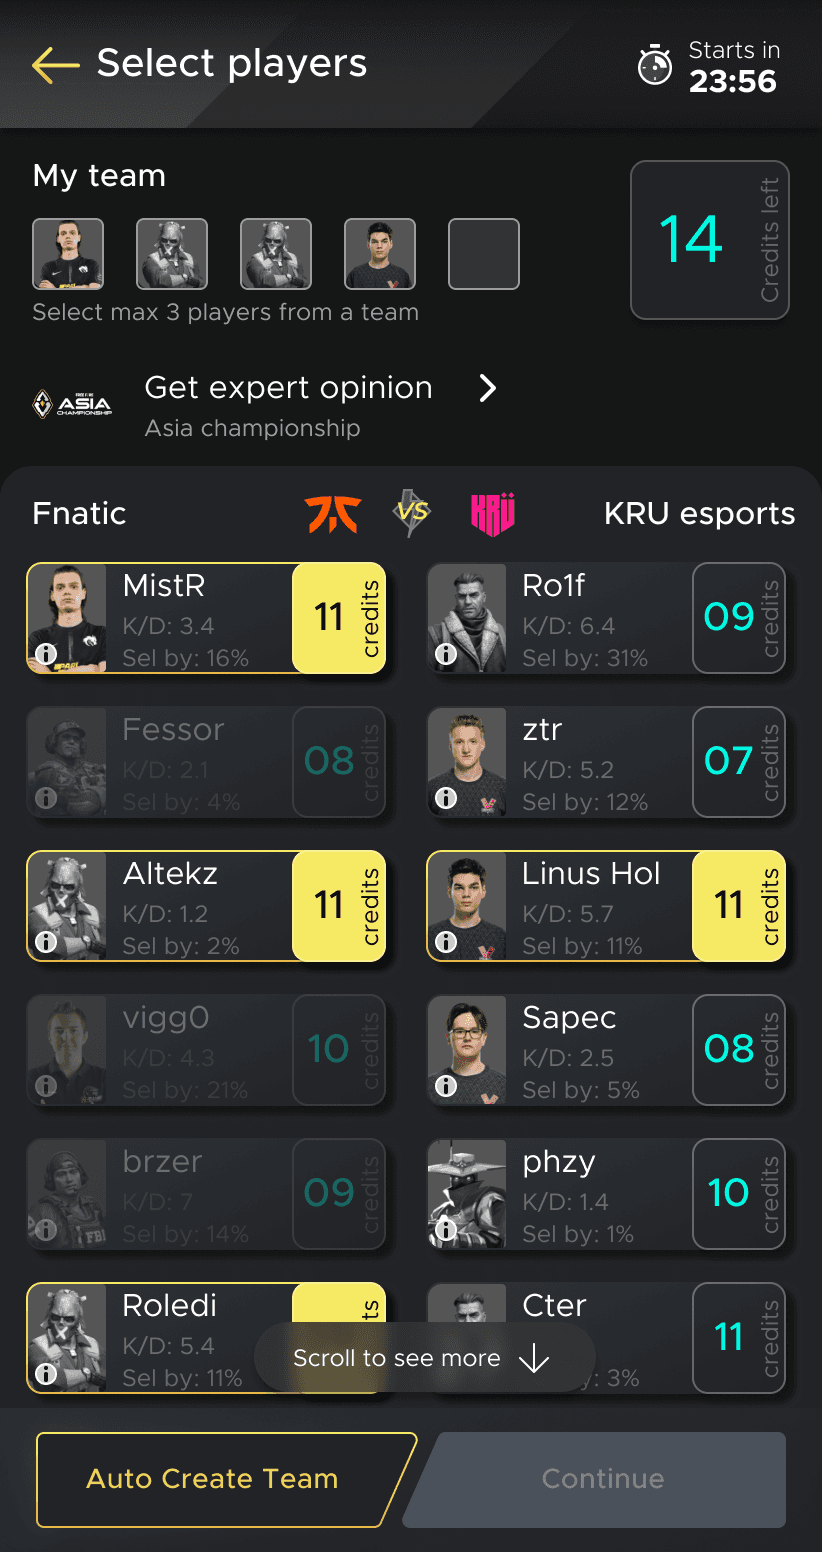
previous screen (A)
revamped screen (B)
TESTING
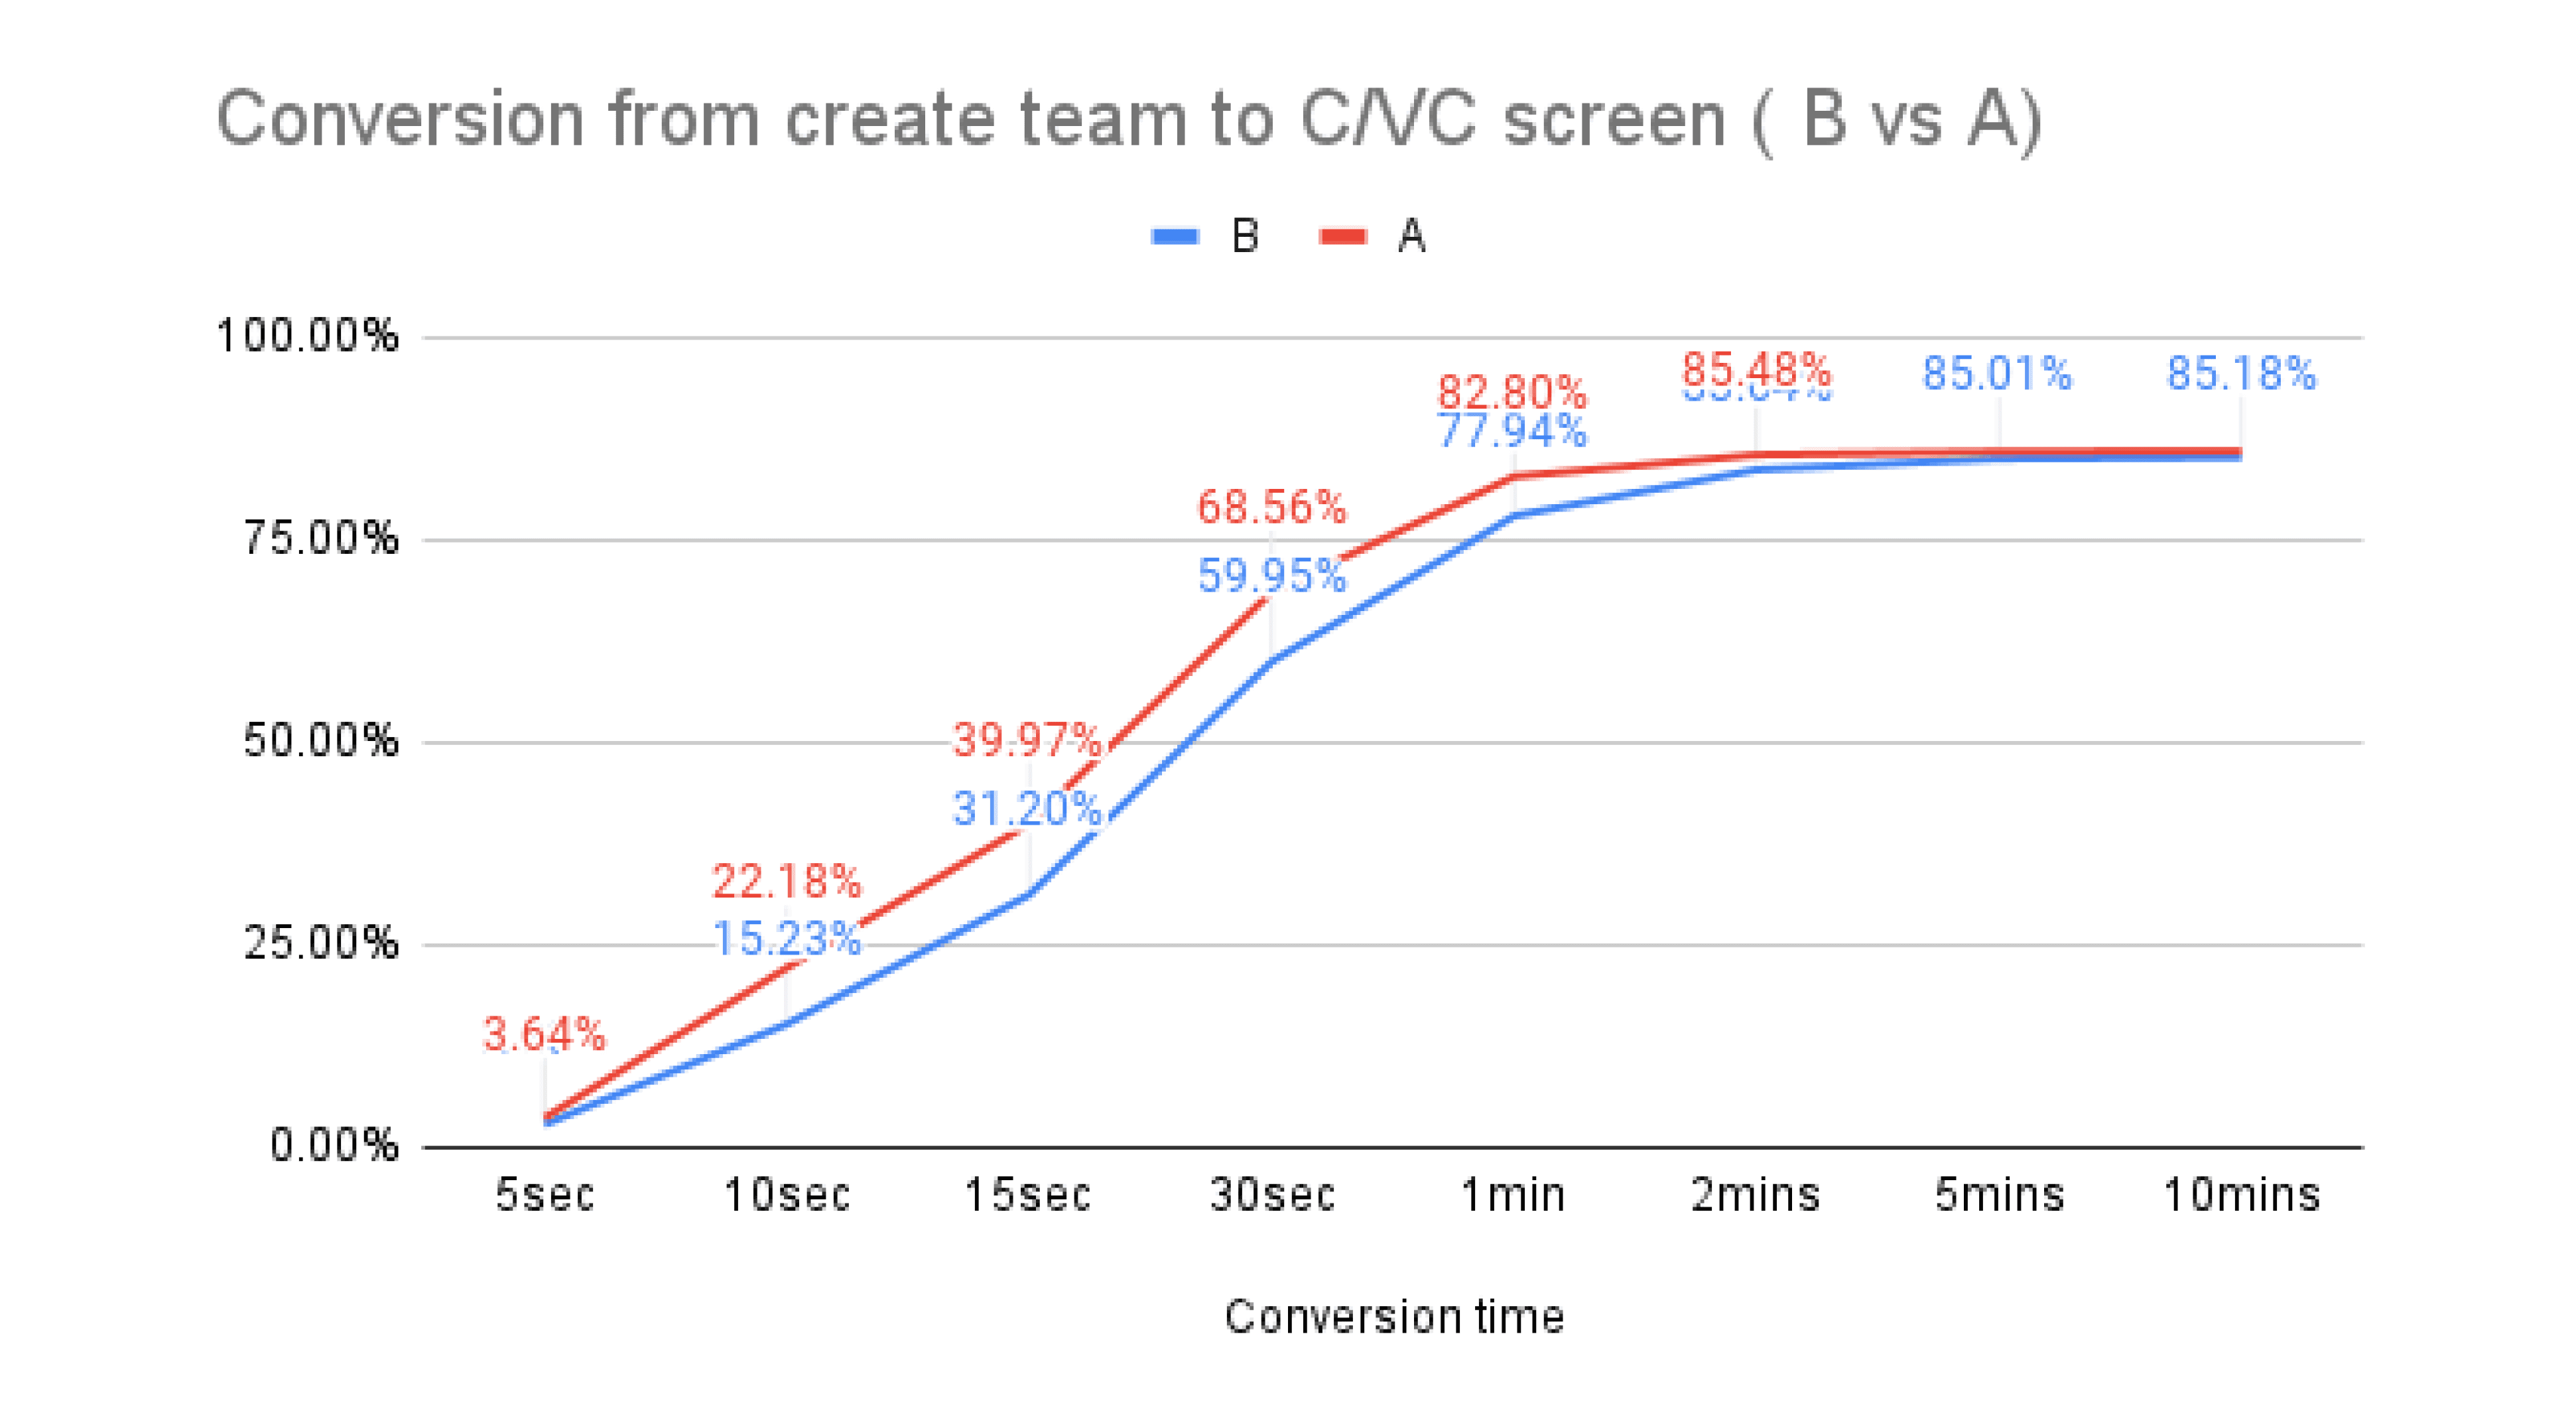
conversion rate vs/ conversion time graph comparing previous screen (a) with revamped screen (b)
goals (A vs B)
findings (A vs B)
hypothesis (A vs B)
to understand the amount of time users are spending in creating a team
the conversion rate over time in version A is better than version B
(X) revamped create team flow is tough to understand for the users
to find out the drop-off rate on create team page
conversion time increased but overall conversion was the same
(Y) users are taking time to analyze and create a better team, as overall conversion rate is the same
does this mean users are taking longer to create their team?
conversion rate vs/ conversion time graph comparing payment completion of users for previous screen (a) with revamped screen (b)
to conclude our results, we needed to prove one of our hypothesis correct
findings (X vs Y)
conclusion :)
Even after taking longer to create a team, version B users charged (payment) rate was more than that of version A
feature upgrade was a success as we could see increase in feature usage
overall conversion for charged users is 11% more in version B
some UI and technicals bugs were noticed that could be fixed
aesthetic-usability effect was noted
no significant difference was noticed in drop offs on create team page
19% increase usage on expert opinion
28% increase in usage of player stats
for doing so, we ran another test to monitor the payment rate through both the flows A and B. this would help us understand the comparison between users who were able to successfully complete all the tasks until payment.
goals (X vs Y)
to understand the number of users who complete the flow by completing the payment for a contest
to evaluate the previous hypothesis
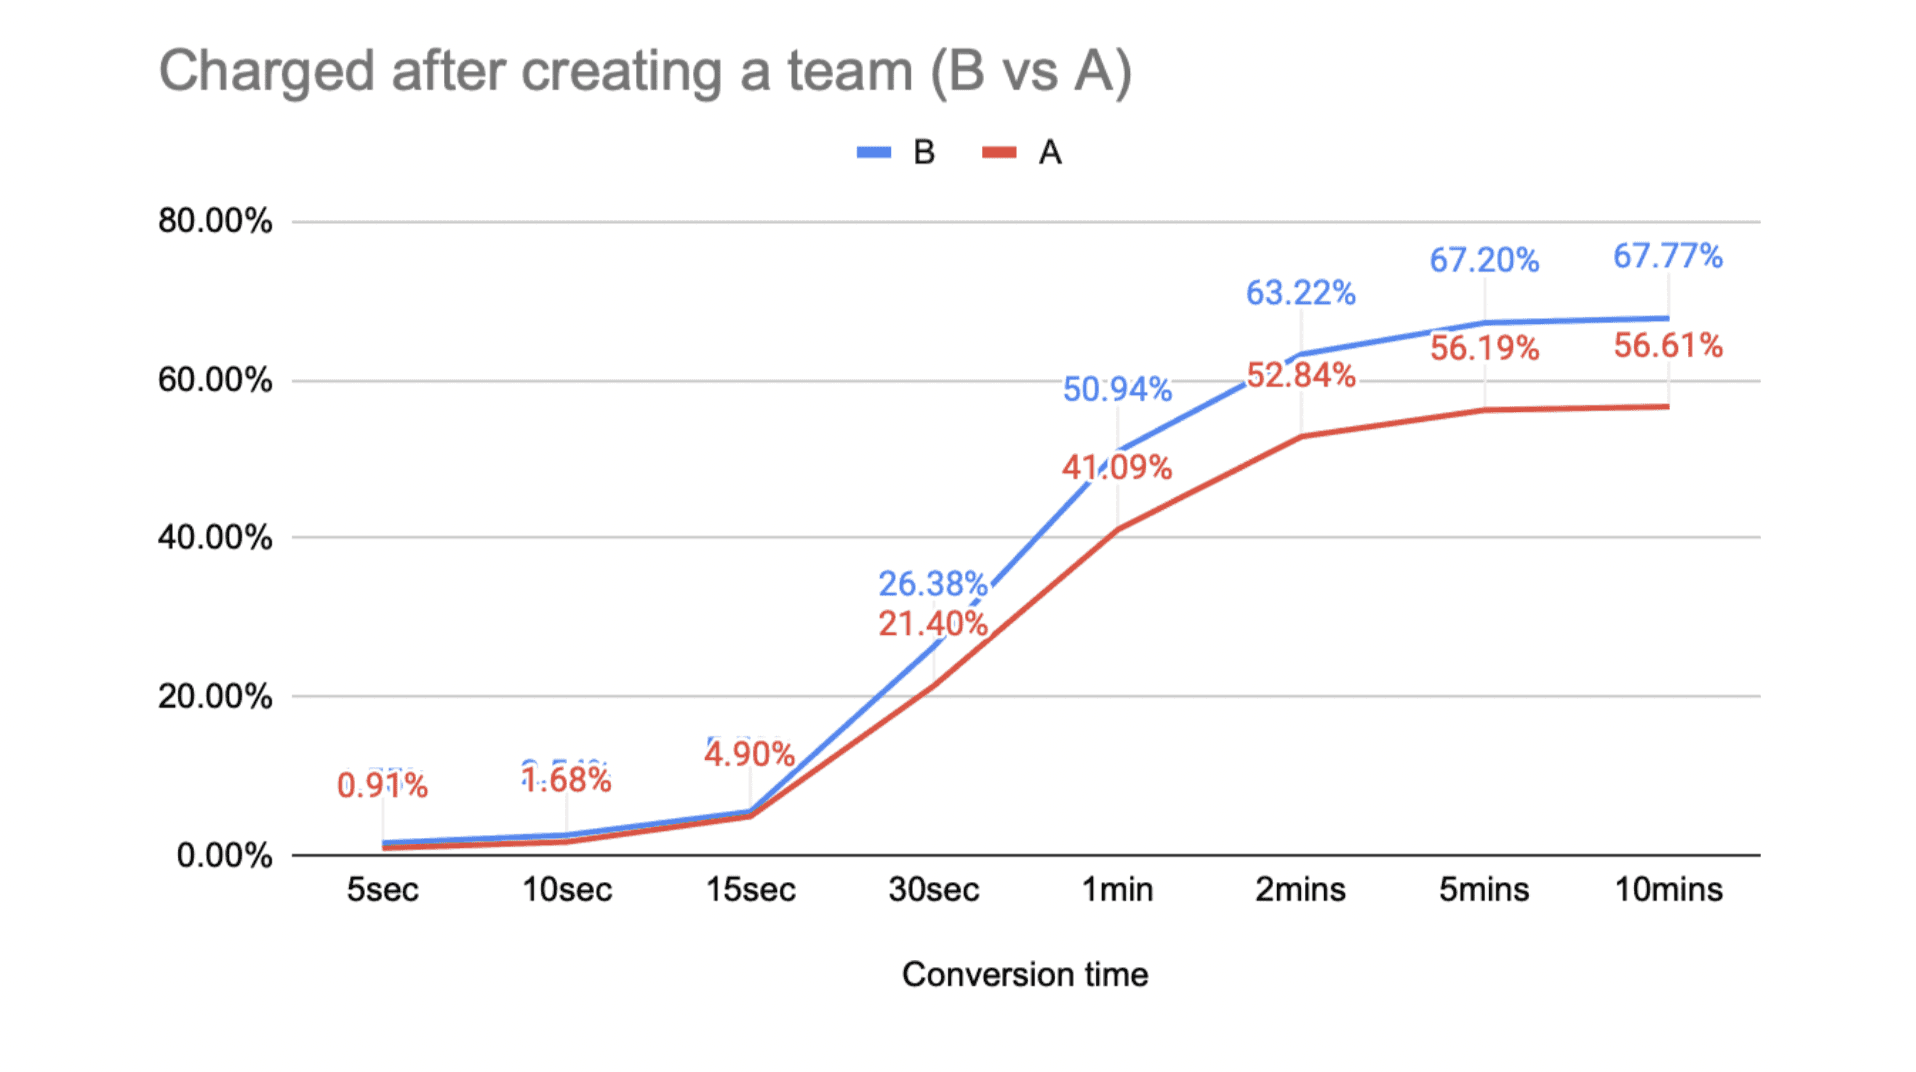
we could prove that hypothesis Y (users are taking time to analyze and create a better team, as overall conversion rate is the same), is correct. along with that, few other data points gathered by the data team corroborated our facts.
we got the desired results
the drop-off rate declined significantly, and the conversely, the task completion rate for 'create team' flow climbed to 94%, up from 73% with the previous design.
INFERENCE
for my most recent professional experience, i could see my work turn into something more specific, systematic, and iterative
thank you! :)
data. data. data! data should inspire designs decisions.
one solution is not enough, one testing type is not enough.
if you have insights, if you have markers, if you have quantified metrics, it really helps to compare enhancements in numbers, it works with the designers' mental model to achieve a goal that is quantified. it helps target specific funnels. if data does not drive design decisions and goals, it should.
sure, one solution with some problems addressed can change the metrics, but how do we compare that with other improved solutions? designing and testing multiple variants, and iterating them until you reach a saturation point, is a very strong approach. only testing through metrics does not help, corroborating them with actual tests and interviews justifies our approach.
REFLECTION